Author: Zoltan Simandi, Ph.D.
An overview of manual vs. automated cell counting
Cell counting is a key step in many modern experimental, clinical and diagnostic workflows. Knowing accurate cell counts is important for standardizing protocols, seeding cells for subsequent experiments, monitoring cell viability and proliferation rate, assessing immortalization, evaluating efficiency of transfection, and is especially critical in clinical diagnosis. Consistent cell numbers ensure experimental reproducibility and accuracy across multiple experiments.
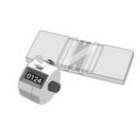
Manual cell counting is still the standard method of quantification of cells in most research labs. The manual procedure of cell counting utilizes a counting chamber called hemocytometer, a device invented by the 19th century French anatomist Louis-Charles Malassez to perform blood cell counts. A large majority of surveyed researchers (71%) count cells using this method1. While manual cell counting is straightforward, it is a vapid step. It requires only a glass hemocytometer and coverslip (or disposable hemocytometer). The chambers of the hemocytometer are filled with cell suspension that is drawn inside the chamber by capillary action. The most laborious and time-consuming step is to count cells using a microscope.
In addition to the obvious time constraint, there are several other issues associated with cell counts obtained by manual counting. First of all, variations in human perception when counting cells versus cell debris or other particles can be significant and extremely detrimental to experimental reproducibility across experimentalists. Manual definition and recognition of a cell versus cell debris or other particles can be challenging, even for the trained eye. Secondly, counting enough events needs a persevering end-user. Countless hours spent in front of the microscope can be really daunting, and this often leads to counting insufficient number of cells, increasing inaccuracy of the process. In addition, too high or too low density of cells in the suspension can add extra challenges to the process and often require repetition of the whole procedure at a different dilution. Next, the preparation and loading of the cell sample in the hemocytometer can also give rise to errors. Though the hemocytometer contains a given volume, the space between the counting chamber and the cover glass might be slightly increased when the chamber is filled with liquid. This can also lead to errors as the estimation of cell count is based on incorrect volume.
--------------------------------------------------
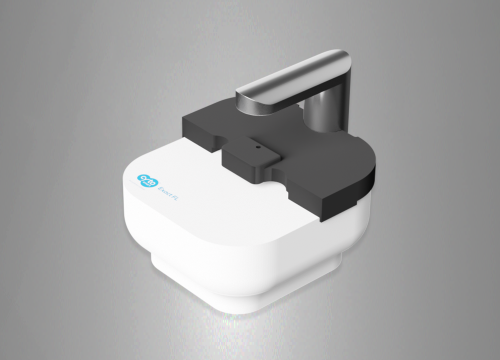
For researchers interested in applying automated fluorescence cell counting to their laboratory practice, we recommend the CytoSMART Exact FL. This cell counter is equipped with an advanced optical system and highly trained pattern recognition software that generate accurate and reliable cell counts in a fraction of the time.
--------------------------------------------------
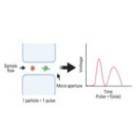
Fortunately, days of manual cell counting are steadily coming to an end with new technologies emerging. In recent years, automated cell counting has become an attractive alternative to manual cell counting because it offers more reliable and reproducible results in a fraction of the time needed for manual counting2. The three main automated cell counter technologies are based on electrical impedance, (fluorescent) flow cytometry, or image analysis (Figure 1).
1. Electrical impedance is the traditional method in almost every hematology analyzer. In brief, cells are passed through between two electrodes. The aperture is so narrow that only one cell can pass through at a time. The impedance changes as the cell passes through and is proportional to cell volume, resulting in a cell count and measure of volume3.
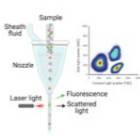
2. In laser flow cytometry, a single-cell stream passes through a laser beam. The absorbance and the scattered light are measured at multiple angles to determine the diameter and granularity of a cell. Adding fluorescent reagents allows to measure specific cell populations4. Importantly, conventional flow cytometers cannot determine cell numbers because they do not record the volume of liquid that passes through the laser beam. In contrast, volumetric flow cytometry can be used to count the absolute number of cells in unit volumes of liquid. Despite the numerous benefits, the cost of the machine, the complex fluidic, optical and mechanical configuration of these devices, and the special training that is required prior to using the instruments makes flow cytometry less suitable for quick and routine cell counting in research labs.
3. Image analysis based on fluorescent microscopy technique for counting cells became widely popular due to the fact that these instruments are cost-effective, easy to use, and basically maintenance-free, making them the most affordable and practical among all the automated cell counting technologies. These instruments include a fluorescence microscope module and an image analyzing/counting algorithm and capable of utilizing sensitive fluorescence dye staining. Importantly, counted cells can be easily checked visually in real-time or later to ensure that the cell analysis is accurate and reliable.
| Hemocytometer | Electrical impedance | Flow cytometry | Image analysis | |
|---|---|---|---|---|
 |
 |
 |
 |
|
| Time/throughput | Slow, low-throughput | High-throughput | High-throughput | High-throughput |
| Reproducibility | Low | High | High | High |
| Upfront cost | Inexpensive | Expensive | Expensive | Affordable |
| Maintenance | Not required | Required | Required | Rarely |
| Training | Simple / Not required | Required | Required | Simple / Not required |
Table 1. Overview of the benefits of the three main automated cell counting technologies over manual cell counting.
In summary, application of automated cell counters leads to higher precision and reproducibility by eliminating human bias to influence results. The software algorithm of the newer cell counters defines a cell consistently for every analysis. The software also eliminates any human errors in calculations. Moreover, these instruments typically alert if you have too few or too many cells in the sample, ensuring statistically significant data generation. Among the three main types of automated cell counting technologies, the image-based cell counting is the most flexible, affordable, and reliable for everyday laboratory use.
Comparisons of Trypan blue and fluorescence-based cell counting and viability detection methods
Some of the early versions of automated image analysis-based cell counters were designed to utilize the same Trypan blue staining procedure as the manual counting. However, in recent years it became clear that replacement of Trypan blue by fluorescent probes can further advance the reproducibility and accuracy of the process.
So what makes the application of fluorescence staining so advantageous in cell counting over routine Trypan blue staining? Trypan blue stains dead cells with a permeable cell membrane, whereas viable cells are not stained. Since the intensity of the stain can vary, it can be difficult to determine whether a cell stains positive with Trypan blue or not. In samples with low viability, the Trypan blue-stained dead cells exhibit large, dim, non-uniform diffused characteristics due to the loss of cell membrane integrity. In these cells, Trypan blue is not contained within the cytosol, which leads to the formation of large, faded cells, making cell counting challenging using light microscope. Also, given that Trypan blue is toxic to cells, analysis has to be completed in a certain timeframe, usually within 5 to 30 minutes. Potential morphological changes may also occur as a consequence of different concentrations of Trypan blue, resulting in faint, diffused, colored balloon structures, thus leading to the overestimation of viability of the sample. Trypan blue is in fact known to overestimate the viability of cell populations and caution must be taken when interpreting Trypan blue-based viability data5,6.
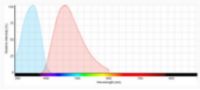
The use of appropriate fluorescent probes can resolve many, if not all of these concerns. In brief, the utility of fluorescent probes arises from their ability to respond to illumination by specific wavelengths of light with the emission of longer wavelengths of light. For each fluorescent probe there is a spectral profile that characterizes its absorption of light (excitation) and another profile that characterizes its emission of light. The distance between the peaks of excitation and emission profiles, called the Stokes shift, determines how useful the fluorophore is for microscopic detection. Over the last two decades, there have been various publications on comparing Trypan blue and various fluorescence-based cellular viability assays6-8. Common fluorescent probes include 4′,6-diamidino-2-phenylindole (DAPI), Propidium iodide (PI), Acridine orange (AO), SYTO 10, Bodipy Fl, and Texas Red. Classification and application of these fluorescence dyes are based on their chemical, physical and fluorescent characteristics. In fluorescence cell counting, the features such as cell membrane permeability, fluorescence strength and fluorescence spectrum of the dyes are important factors that need to be considered. DAPI, Propidium iodide, and Acridine orange have been most widely used in cell counting (Figure 2).
DAPI is an efficient stain for dead cells, as living cells are impermeable to low concentrations of DAPI. DAPI fluoresces blue upon binding to AT-rich clusters in the minor groove of double stranded DNA9. Upon excitation at 365 nm, DAPI emits blue fluorescence with maximal emission at 461 nm.
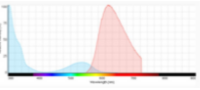
Propidium iodide (PI) does not enter cells with intact cell membranes or active metabolism. In contrast, cells with damaged membranes or with inactive metabolism are unable to prevent PI from entering the cell. In fact, PI has been shown to enter cells faster than Trypan blue. Moreover, PI binds to the DNA and is retained within the nucleus regardless of membrane integrity. Thus, PI has the potential to measure dead cells more accurately and it is routinely used to stain and identify late apoptotic and necrotic cell populations10. In aqueous solutions, PI has excitation/emission maximum of 535 / 617 nm11.
Acridine orange (AO) is cell-permeable, and it binds primarily to cellular DNA, which makes it suitable for counting total cell numbers. Upon excitation at 505 nm, acridine orange emits green fluorescence with maximum emission at 525 nm12.
In addition to the listed examples, further probes are available that are initially non-fluorescent, but in metabolically active cells these dyes are converted into fluorescent forms. Such example is calcein (calcein-AM).
| DAPI | Propidium iodide | Acridine orange | |
|---|---|---|---|
| Specificity | Dead cells | Dead cells | All cells |
| Nucleic acid binding | Yes (dsDNA) | Yes (DNA, RNA) | Yes (dsDNA, ssDNA, RNA) |
| Excitation | 360 nm when bound to dsDNA |
535 nm | 500 nm (DNA), 460 nm (RNA) |
| Emission | 456 to 460 nm when bound to dsDNA |
617 nm | 526 nm (DNA), 650 nm (RNA) |
 |
 |
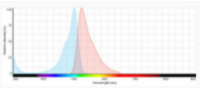 |
Table 2. Characteristics of common fluorescence staining used for live/dead and total cell number counting.
The ability to quantify multiple labels within the same sample (e.g. DAPI or PI + AO) allows to extract more accurate cell count information. As a result of AO counterstaining, both the viable and non-viable cells can be stained, providing a total cell count information. This way we can get total cell counts and the percentages of viable and dead cells. Double staining also allows to more precisely distinguish cells from undesirable debris.
While fluorescent probes provide a valuable tool for assessment of cell numbers, there are some limitations to their use. Fluorophores can lose their fluorescence ability during a process known as fading. It is important that counting is accomplished in a relatively short time. Nevertheless, automated cell counting using appropriate fluorescent probes for counterstaining is currently considered as a state-of-the-art method to get accurate cell counts, without the associated time, subjectivity, and user-to-user variability.
Applications of fluorescence cell counting
Automated fluorescence-based technology provides a large flexibility for cell counting and can be especially useful in applications where bright-field image analysis is not possible. Many samples or cell types are difficult to count with conventional bright-field imaging. The following applications represent only a few cases where fluorescence cell counting can be particularly useful:
Assess viability of peripheral blood mononuclear cells. Peripheral blood mononuclear cells (PBMCs) are usually mixed with large amounts of erythrocytes, which may be counted as dead cells in bright-field image analysis. Since mature red blood cells and platelets lose their nuclei during cell differentiation, they do not stain with either dye. Accordingly, using automated cell counting with AO/PI dual staining, the red blood cells and platelets can be easily excluded from the total cell count.
Cell counts in lymphoma. Leukemia/lymphoma samples represent another difficult-to-count cell sample type, where routine and accurate cytogenetic assessment is essential for appropriate diagnosis and treatment. In these samples double staining is also required to assess total cell count and viability. The first staining, such as AO, stains all nuclei and separates cells from erythrocytes and debris. This is important since erythrocytes and debris would be negative for staining, such as PI or DAPI and would artificially increase the measured viability of cells in a sample.
Cell counts of tumor associated macrophages. Analysis of tumor microenvironment and, particularly, of the different types and functions of tumor-associated macrophages is indispensable. Image-based fluorescence analysis also allows automated detection of macrophages and other cell types in immunostained lymphoma tissue samples.
Evaluation of transfection efficiency. Another often underappreciated application of fluorescence cell counting technologies is the ability to directly evaluate transfection efficiency. For instance, if green and/or red fluorescent channels are available on the cell counter, it becomes possible to quickly and quantitatively measure %RFP or %GFP positive cells in samples containing GFP/RFP and non-expressing cells.
Quantify cells based upon physiological state. While undertaking quantitative analysis of cell cultures and living tissues presents a variety of practical challenges, the ability to quantify cells based upon physiological state is at least a potential consideration when using fluorescent probes. When used with dye image-based cell counters, flow cytometers can determine not only the number of cells in the sample, but also the proportion of viable cells. Whereas, most cell counters can only determine the total number of cells in the sample. There is a wide variety of fluorophores that can be used to monitor cellular physiology and reflect changes in pH, calcium concentration, membrane potential, oxygen radical concentration, and so on.
Future of fluorescence cell counting
Cell counting is the bane of existence of many researchers, and the tedium associated with manual counting is evident. One of the main barriers to using an automated system is the cost of these large benchtop instruments. However, automated fluorescence imaging-based instruments became highly affordable in recent years, with low maintenance-associated fees. Another barrier to more-widespread use of automated cell counters is the relatively high cost of non-reusable hemocytometers. It is particularly important that newer cell counters can be operated by reusable glass hemocytometers.
Nevertheless, automated cell counting is still undergoing a continuous development. In addition to utilizing fluorescence staining, a major effort has been focusing on improving the software of these instruments. Several programs for automated cell counting have been developed so far, but most of them demand additional training or data input from the user. Most of them do not allow the users to online monitor the counting results, either. Machine-learning algorithm has been developed by expert cell biologists to ensure accurate and precise cell counting. This is particularly important in those samples where cells are prone to form clusters. Optimized illumination and automated focus on the cells can minimize user variation associated with manual focusing and lighting adjustments and accurately count cells that clump together. Further advancements in software development can also help to efficiently deal with non-convex overlapping objects, that are virtually inseparable with conventional image processing methods. This will also help to improve cell counting of clumpy cells, which is currently still challenging.
New developments for the next generation of automated cell counters should also consider new trends in cell culturing and disease modeling. In recent years, cell culture models went through several changes and new demands appeared, such as organoid counting. Organoids constitute an improvement in the generation of cellular model systems and provide a powerful new way for studying human development, physiology, and disease13. Software that can allow to count organoids and assess organoid size variability, will be particularly useful for researchers.
Conclusions
Cell counting has gone through a remarkable transition in the last two decades, and it is not going to go away. Increasing number of research labs has changed from laborious manual cell counting to some form of automated cell counting. Imaging-based fluorescence cell counting, the most affordable and flexible automated method, is already very popular among researchers, who recognize that this approach does not only save them time, but also offers numerous benefits over the manual counting methods.