Authors: Lieke Stemkens and Inge Thijssen - van Loosdregt, PhD
Introduction
Cell viability assays are relatively easy tests to determine the effect of environmental changes on the state of survival of cells in vitro. Unfortunately, these assays are often endpoint measurements and therefore do not provide any information about dynamic processes, such as the rate of cell death. Apoptosis assays, on the other hand, are kinetic assays that can provide insight into the dynamics of cell death due to environmental changes.1
Apoptosis, unlike necrosis, is a form of controlled and programmed cell death. It is necessary for certain cellular processes, such as proper growth, development, and homeostasis. However, it also occurs in response to cellular stress, for old cells that are no longer needed or to eliminate cells that are potentially harmful.2 Additionally, apoptosis is a reversible process, meaning that cells can be rescued up until a certain point in the apoptotic pathway.3 In the first stage of apoptosis, cells display several characteristic morphological changes, like cellular shrinking and membrane blebbing. When cells get to the point of no return, the cell breaks apart into multiple vesicles, which are removed by the immune system to prevent local inflammation. In contrast, necrosis is caused by external factors and results in an uncontrolled release of cellular products and loss of the cell membrane integrity, causing an inflammatory response in the surrounding tissue.4
When investigating the apoptotic process, it is crucial to know and understand when, how and to what extent a certain environmental change affects the cells. Live-cell imaging is an essential tool to study dynamic cellular activities in real time. When combined with fluorescence, this can result in both qualitative and quantitative kinetic data.5
In this study, we used fluorescence live-cell imaging to investigate the effect of H2O2 on the apoptotic pathway in Chinese hamster ovary cells (CHO-K1 cells). A hallmark of early apoptosis is the translocation of phosphatidylserines (PS) from the inner layer of the cell membrane to the outer layer, exposing PS to the external environment. Exposed PS is detected by annexin, a protein that binds to PS in a calcium-dependent manner.6 pSIVATM-IANBD is a novel conjugate comprised of pSIVATM, an annexin probe and the polar sensitive IANBD dye, resulting in a green fluorescent signal when bound to PS. Therefore, green fluorescences by this conjugate represents a hallmark of early apoptosis.7 To visualise cell membrane integrity, the apoptosis assay was performed using pSIVA in conjunction with propidium iodide (PI), a red fluorescent nuclear dye that binds to double stranded DNA, to track the loss of cell membrane integrity and nucleus defragmentation during the process of late apoptosis/necrosis.
To obtain automated fluorescence live-cell images, the CytoSMART® Lux3 FL was used. The CytoSMART® Lux3 FL is the smallest fluorescence live-cell imaging device currently available and is designed to work from inside any cell culture incubator. Furthermore, the CytoSMART® Lux3 FL can make time-lapse videos with brightfield, green fluorescence and red fluorescence in parallel, a perfect match for an apoptosis assay utilizing pSIVA and PI.
Material and Methods
CHO-K1 cells were seeded into a 48 well plate at a concentration of 30,000 cells per well in F12 Nutrient mixture medium (Invitrogen) supplemented with 10% Fetal Bovine Serum (FBS; Gibco) and 1% penicillin-streptomycin (PS; Gibco). After a confluence of 70% was achieved, the sample was rinsed with phosphate-buffered saline (PBS; Gibco). 500 µl culture medium was added and supplemented with 1 µl CaCl₂ (1 M; Sigma Aldrich ), 10 µl pSIVA™-IANBD (pSIVA; Novus Biologicals) and 20 µl propidium iodide (PI; Novus Biologicals). In addition, to induce apoptosis, 1 µl H₂O₂ (0.6 M; Sigma Aldrich) was added to the cells.⁸ Thereafter, the sample was immediately placed on the CytoSMART® Lux3 FL in the cell culture incubator, to obtain time-lapse images at 37 °C and 5% CO₂ (Figure 1). A snapshot was made every 10 minutes for a time span of 24 h using the brightfield, green fluorescence and red fluorescence channel.
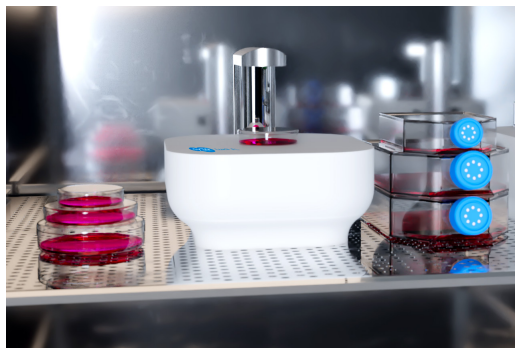
Figure 1. The CytoSMART® Lux3 FL inside a cell culture incubator
The time lapse videos and images were downloaded from the CytoSMART® Cloud. The number of cells were counted for each channel, resulting in a ratio of green cells and red nuclei relative to the total number of cells in the brightfield channel at each timepoint.
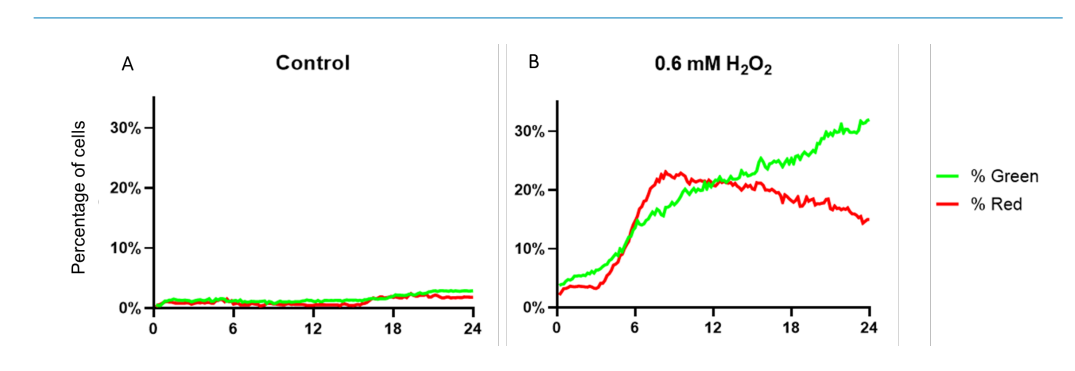
Figure 2. Percentage of cells that display green (pSIVA; early apoptotic cells) and red (PI; late apoptotic/necrotic cells) fluorescence over time, with A; control group and B; 0.6 mM H₂O₂.
Results
Immediately after placing the sample on the CytoSMART® Lux3 FL, green (early apoptotic) and red (late apoptotic/necrotic) cells could be observed in the control and H2 O2 treated sample. The percentage of green and red cells in the control sample remains steady and minimal over time (Figure 2A, Figure 3 (top row)), with the highest percentage reached after 24 hours (2.8% and 1.8% for green and red respectively). In contrast, cells treated with H2 O2 display an increase in green and red signal over time (Figure 2B, Figure 3 (bottom row)). After 24h, 31.8% of the cells developed a green signal, while the peak for the red signal is visible after 8h (22.6%) and decreases to 15% at 24h.
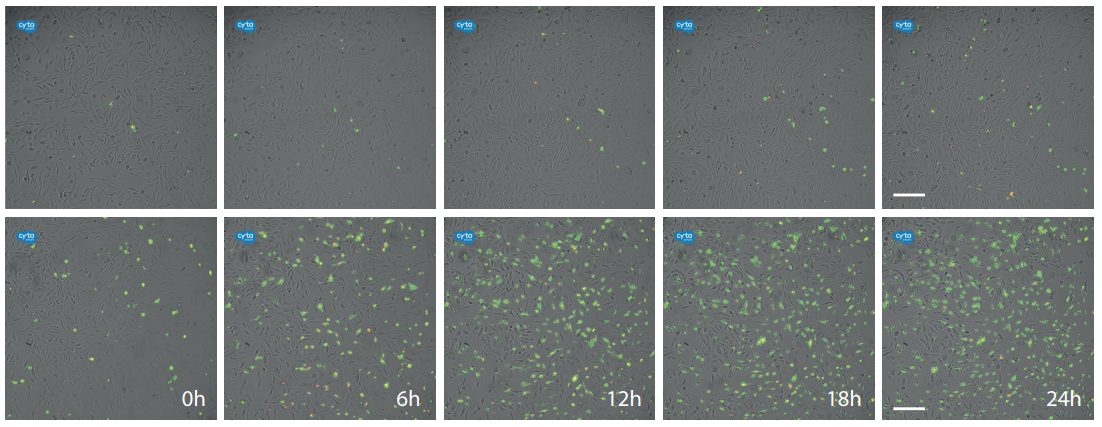
Figure 3. Fluorescence live cell imaging of the control (top) and H2 O2 treated sample (bottom) at 0h, 6h, 12h, 18h and 24h. Cells that are in early apoptosis emit a green fluorescence while necrotic cells only have a red nucleus. A green cell with a red nucleus indicates late apoptosis. Scalebar: 200 µm.
Discussion
To understand the effect environmental changes have on cells, cell viability assays are commonly used. These are often endpoint measurements, which can result in data misinterpretation. Therefore, a dynamic approach is preferred. By performing an apoptosis assay using fluorescence live cell imaging, one obtains qualitative and quantitative kinetic data to understand when, how and at what pace cell death occurs. In this study, we used the CytoSMART® Lux3 FL in combination with pSIVA and PI to examine the apoptotic effects of 0.6 mM H2 O2 on CHO-K1 cells. The CytoSMART® Lux3 FL took a snapshot every 10 minutes to detect green fluorescence, caused by the presence of PS on the outer cell membrane, and red fluorescence, triggered by loss of cell membrane integrity and defragmentation of the nucleus.
Here, it was shown that the addition of 0.6 mM H2 O2 had a direct apoptotic effect on CHO-K1 cells, proved by the immediate increase of green and red fluorescence. While the green signal gradually developed over time, the red signal increased drastically, peaks, and slowly decreased again. This is caused by differences in degradation of the cell membrane and the nucleus. When the cell has completed apoptosis, the cell membrane and the nucleus will fall apart. While the pSIVA is still bound to the PS in the membrane fragments and remains to emit a green fluorescence, the double stranded DNA in the nucleus is completely disintegrated. Hence, resulting in a decrease of red signal over time. The importance of live cell imaging comes into play here, as the peak and decrease in signal of the PI would not have been captured in an end-point measurement.
Because apoptosis is a necessary process for appropriate growth, development, and homeostasis for cell cultures in vitro, it is not surprising to see a little green and red fluorescence in the control sample. Particularly because the cells had reached a confluency of >90%, causing scarce growth space and a transition to the plateau phase of cell growth.9
Conclusion
In this study, we have shown that the CytoSMART® Lux3 FL is capable of automated fluorescence live cell imaging over time. In addition, two fluorophores were imaged in parallel with brightfield images to obtain qualitative and quantitative kinetic data of the process of apoptosis in H2O2 treated CHO-K1 cells.
References
[1] Posimo, J. M. et al. Viability assays for cells in culture. J. Vis. Exp. 50645 (2014). doi:10.3791/50645
[2] Elmore, S. Apoptosis: A Review of Programmed Cell Death. Toxicologic Pathology 35, 495–516 (2007).
[3] Nagata, S., Suzuki, J., Segawa, K. & Fujii, T. Exposure of phosphatidylserine on the cell surface. Cell Death and Differentiation 23, 952–961 (2016).
[4] Fink, S. L. & Cookson, B. T. Apoptosis, pyroptosis, and necrosis: Mechanistic description of dead and dying eukaryotic cells. Infection and Immunity 73, 1907–1916 (2005).
[5] Waters, J. C. Live-cell fluorescence imaging. in Methods in Cell Biology 114, 125–150 (Academic Press Inc., 2013).
[6] Martin, S. J. et al. Early Redistribution of Plasma Membrane Phosphatidylserine Is a General Feature of Apoptosis Regardless of the Initiating Stimulus: Inhibition by Overexpression of Bcl-2 and Abl.
[7] Kim, Y. E., Chen, J., Chan, J. R. & Langen, R. Engineering a polarity-sensitive biosensor for time-lapse imaging of apoptotic processes and degeneration. Nat Methods 7, 67–73 (2010).
[8] Han, Y. H. et al. Effects of chicken selenoprotein-W on H2 O2 -induced apoptosis in CHO-K1 cells. Biol. Trace Elem. Res. 147, 395–402 (2012).
[9] Pavel, M. et al. Contact inhibition controls cell survival and proliferation via YAP/TAZ-autophagy axis. Nat. Commun. 9, (2018).