Authors: Dr. Inge van Loosdregt, Annemie Koonen-Reemst, Joffry Maltha
Cell viability is of interest for many researchers in the fields of drug development, cancer research and regenerative medicine. Nowadays, more and more research is focused on the long- term effect of a certain compound on cell viability. Common methods to determine cell viability are cell counting, live/dead viability staining and metabolic activity assays.
Counting cells using dye exclusion methods (such as the Trypan Blue exclusion technique) is simple and quick but does require the cells to be in a single cell suspension before counting them with a hemocytometer or automated cell counter [1]. This invasive technique makes cell counting unsuitable for long- term viability monitoring. One option to enable long-term viability monitoring using cell counting would be to repeat the cell counts with different samples at different time points, which requires high numbers of cells, disposables and reagents. Moreover, this method is very time consuming and labor intensive since the samples need to be counted one at the time.
A live/dead viability staining usually consists of a dye that specifically stains live cells combined with another dye that stains dead cells [1]. The ratio of live and dead cells can easily be determined by counting the cells manually or by using image analysis software. This method provides very accurate live/dead counts, but can also be very time consuming when analyzing large numbers of samples. Next to this, some of the dyes that are used can be toxic upon long incubation times. An issue that can occur in case of long-term viability monitoring is fading of the dye over time due to cell division during the experiment.
The well-known MTT [2] and resazurin (Alamar Blue [3]) assays use metabolic activity as a measure for cell viability [4]. A compound of a certain color is enzymatically converted into a (fluorescent) compound of a different color by metabolically active cells. The amount of absorbance/fluorescence of the converted compound can thus be used as a measure for cell viability. The advantage of metabolic activity assays over cell counting and live/dead staining is that multiple samples can easily be analyzed at once with the use of a plate reader. However, they are unfit for long-term viability monitoring since most of the reagents are toxic [4]. The only option to measure viability at multiple time points is to use numerous samples, requiring high numbers of cells, disposables and reagents. Furthermore, a plateau in the absorbance/fluorescence could be reached in case the compound is completely converted.
A noninvasive alternative for these methods would be to use confluency as a measure of viability. By taking microscopic images of cultured cells at several time points the viability can be followed over time without the need of toxic reagents or sacrificing samples, thus decreasing the amount of samples needed. When using the CytoSMART® Omni, an automated live-cell imager, multiple samples can be analyzed at the same time inside a regular CO2 -incubator. This allows for automated confluency analysis (using the cloud-based CytoSMART® software) at predefined intervals and optimal culture conditions.
The aim of this study was to perform a long-term viability study using confluency measurements obtained with the CytoSMART® Omni.
Material and Methods
A 96-well plate was seeded with C6 cells (rat glial tumor cells) at a density of 21,875 cells/cm2 in Advanced DMEM (Invitrogen) supplemented with 10% FBS (Gibco) and 1% penicillinstreptomycin (Gibco). After 24 h of culture (37°C and 5% CO2 ), the microtubule stabilizer Paclitaxel (PX; Invitrogen) was added to the cells at concentrations ranging from 1.7 nM to 100 µM (1:3 serial dilution). The well plate was placed on the CytoSMART® Omni (at 37°C and 5% CO2 ) to make a high-resolution scan every hour for 70 h after the addition of PX (n = 8 per group). The CytoSMART® image analysis software was used to determine the confluency of each individual well at each time point. The confluency data of each time point was downloaded from the CytoSMART® cloud and normalized for the confluency of the same well at 0 h, to account for differences in confluency at t = 0 h. Differences in normalized confluency between groups were analyzed with SPSS Statistics (IBM) using one-way ANOVA followed by a Bonferroni post-hoc test at t = 6, 12, 24, 36, 48, 60 and 70 h and were considered significant at p < 0.05.
Results
Immediately after addition of 100 µM PX, the cells start to detach and aggregate (Fig. 1A), without being able to reattach during the experiment, leading to an approximately constant confluency between 36 and 70 hours (Fig. 2 and 3). Starting at 48 hours, the normalized confluency of the 100 µM PX treated samples was significantly lower than the normalized confluency of all other groups, except for the group treated with 33 µM PX (Table 1).
When 0.4 to 33 µM PX was added to the samples, the cells lose their elongated morphology and detach (Fig. 1B), with an increasing degree of detachment at increasing PX concentrations. Contrary to the cells treated with 100 µM PX, the cells treated with 0.4 to 33 µM PX seem to be able to reattach or proliferate, as shown by the increase in confluency over time (Fig. 2 and 3). The normalized confluency of these groups was significantly lower than the untreated samples at all time points and the 1.7 nM PX treated samples at 48, 60 and 70 h (Table 1).
The majority of cells treated with the lowest concentrations of PX (1.7 to 137 nM) keep their elongated morphology, while only few cells were completely rounded (Fig. 1C). However, at these concentrations of PX, the cells seem to be unable to proliferate at the rate that the untreated cells do, as shown by the lower confluency levels in Fig. 2 and 3. Only at the latest time-points, some significant differences were found between the samples treated with the lowest concentrations of PX (Table 1).
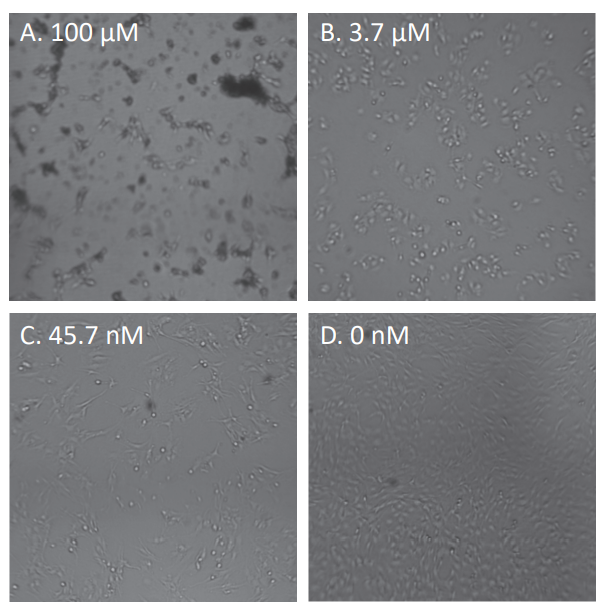
Figure 1. Representative images of the cell morphology, 24 hour after the addition of paclitaxel. Four of the 12 concentrations are shown: 100 µM (A), 3.7 µM (B), 45.7 nM (C) and 0 nM (D).
The untreated cells have an elongated morphology (Fig. 1D) and proliferate at a steady rate, reaching 100% confluency approximately 42 hours after the start of the experiment (Fig. 2 and 3). The normalized confluency of the untreated samples was significantly higher compared to the PX treated samples at all tested time points (Table 1).
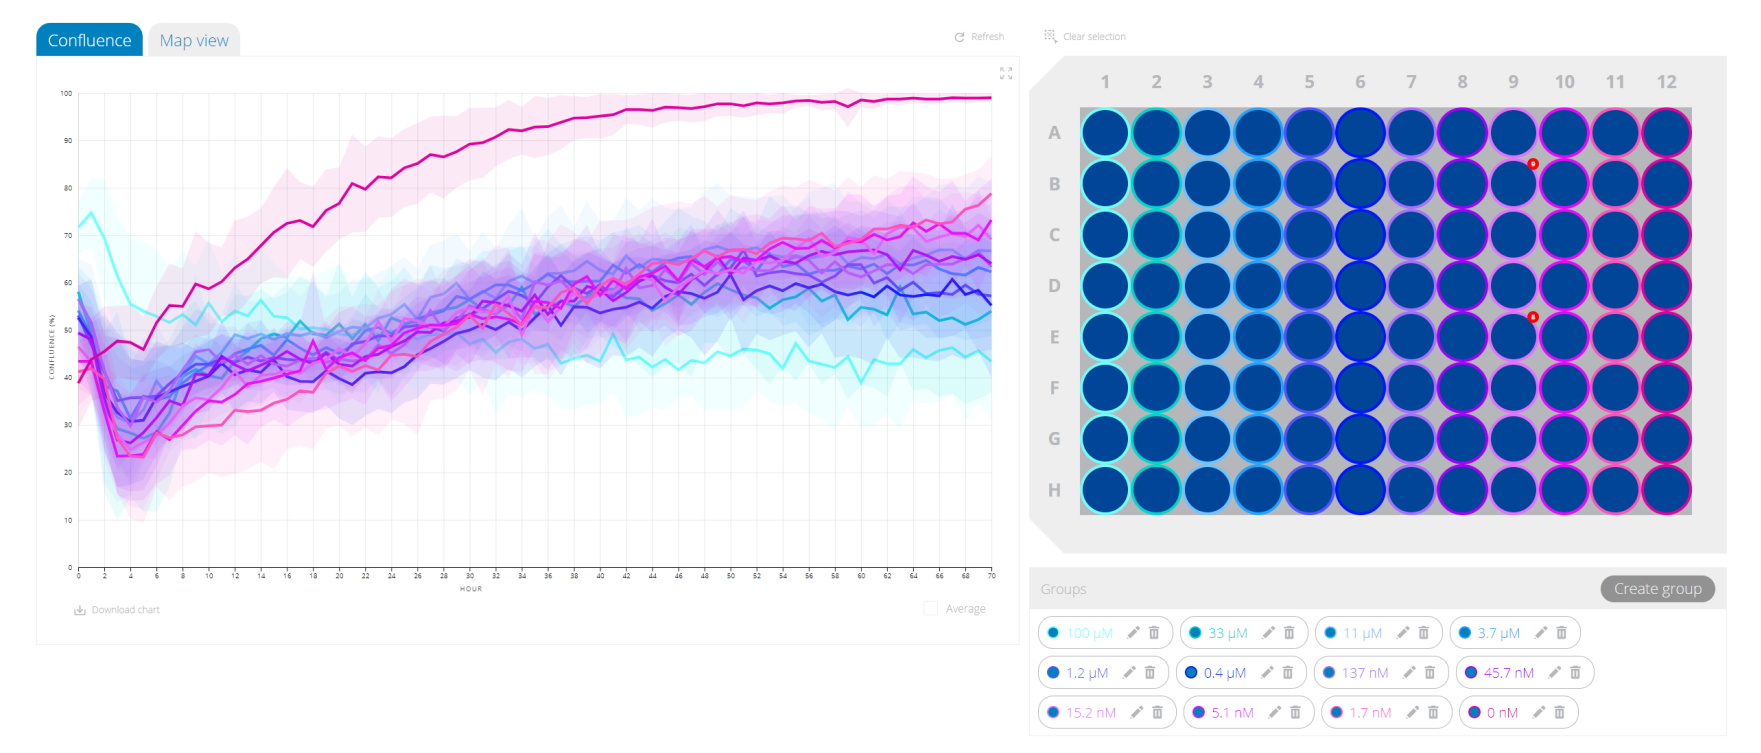
Figure 2. Screen capture of the confluency data in the CytoSMART® cloud. The confluency of each group is shown on the left (mean ± standard deviation). The well plate layout, including the colors of each group, is shown on the right.
Discussion
Cell viability is generally determined via cell counting, live/ dead staining or metabolic activity assays. However, the common drawback of these methods is that they are generally invasive and can thus not be used for long-term viability monitoring. A noninvasive alternative for these methods would be to use confluency as a measure of viability. Therefore, we aimed to analyze a long-term viability study using confluency measurements obtained with the CytoSMART® Omni.
In this study, we showed that cell viability of C6 cells treated with PX could easily be determined from images obtained every hour with the CytoSMART® Omni. At all time-points, the normalized confluency of the untreated samples was significantly higher than that of the PX treated samples. Since PX is a microtubule stabilizer it causes defects in mitotic spindle formation, thus inhibiting chromosome segregation and subsequently cell division [5]. This mechanism of action explains the lower (normalized) confluency of all groups treated with PX compared to the untreated group, at all time-points.
Loubani et al. have shown that PX decreased cell-cell adhesion via cleavage of β- and γ-catenin [6], proteins necessary for coupling cells at the adherens junctions. Furthermore, Ling et al. have shown a decreased expression of α5-, αL- and β7- integrins [7], proteins involved in cell-matrix adhesion. These studies correspond to the decreased adhesion observed in the samples treated with 0.4 to 100 µM PX found in this study.
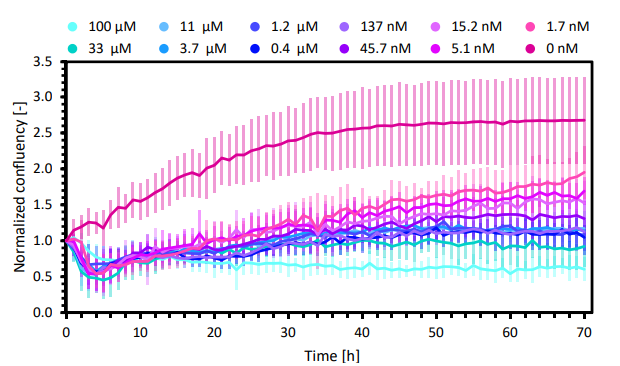
Figure 3. Normalized confluency of the C6 cells treated with 12 different concentrations of Paclitaxel (mean ± standard deviation; n=12).
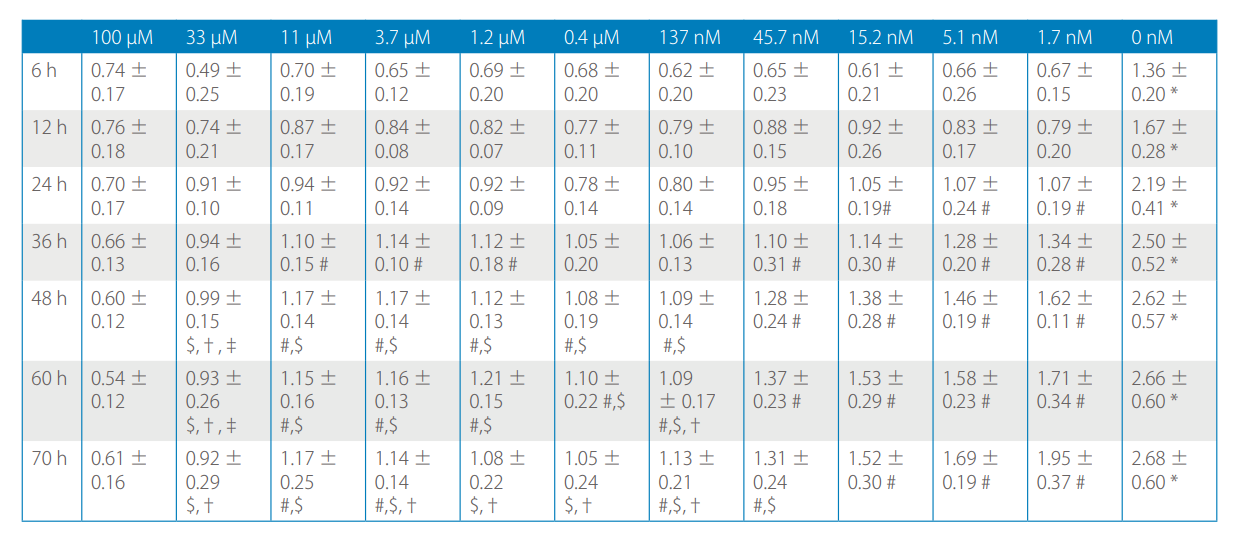
Table 1. Normalized confluency (mean ± standard deviation) at 6, 12, 24, 36, 48, 60 and 70 h after the addition of PX. *: significantly higher than all PX treated groups at the same time point. #: significantly higher than 100 µM PX at the same time point. $: significantly lower than 1.7 nM PX at the same time point, †: significantly lower than 5.1 nM PX at the same time point, ‡: significantly lower than 15.2 nM PX at the same time point.
The use of real-time live-cell imaging to monitor cell viability not only provides quantitative data on confluency but also qualitative information about the cell morphology. Morphological changes provide extra information about the effect of a certain compound on the cells, this information is lacking when analyzing cell viability by using metabolic activity assays or cell counting. In our case, for example, PX not only affects viability but also cell adhesion. The impaired cell adhesion would be unnoticed when only analyzing metabolic activity. When using cell counting to analyze viability, the cells need to be detached from their substrate, which eliminates the ability to detect morphological changes caused by the tested compound. When using live/ dead viability staining morphological changes could be followed over time, however, only one sample can be visualized at the time leading to very time-consuming experiments. This is not an issue when using the CytoSMART® Omni, which automatically images the whole well plate. Next to this, when imaging the cells using a conventional microscope equipped with an incubator box, the temperature- and CO2 -levels are difficult to control. The suboptimal culture conditions could affect cell viability and morphology, which could alter the outcome of the experiments. Using an imaging device, such as the CytoSMART® Omni, inside an incubator could be preferred over microscopes equipped with an incubation chamber since the culture conditions are optimal in the first situation.
Conclusion
Summarizing, in this study, we showed that long-term Paclitaxel treatment not only affects cell viability but also cell morphology. Upon increase in Paclitaxel concentrations, the morphological alterations increase and the confluency level decreases. Furthermore, the noninvasive confluency measurements allowed for long-term monitoring of cell viability in real-time. Using the CytoSMART® Omni also provided the benefit of culturing cells in the optimal culture conditions while monitoring changes in confluency and morphology.
References
[1] M. J. Stoddart, “Mammalian Cell Viability,” vol. 740, pp. 1–6, 2011.
[2] T. Mosmann, “Rapid colorimetric assay for cellular growth and survival: Application to proliferation and cytotoxicity assays,” J. Immunol. Methods, vol. 65, no. 1–2, pp. 55–63, 1983.
[3] S. Ansar Ahmed, R. M. Gogal, and J. E. Walsh, “A new rapid and simple non-radioactive assay to monitor and determine the proliferation of lymphocytes: an alternative to [3H]thymidine incorporation assay,” J. Immunol. Methods, vol. 170, no. 2, pp. 211–224, 1994.
[4] T. L. Riss et al., “Cell Viability Assays,” in Assay Guidance Manual [Internet], vol. 114, no. 8, K. Sittampalam, G. S.; Coussens, N.P.; Brimacombe, Ed. Bethesda (MD): Eli Lilly & Company and the National Center for Advancing Translational Sciences, 2013, pp. 785–796.
[5] B. A. Weaver, “How Taxol/paclitaxel kills cancer cells,” Mol. Biol. Cell, vol. 25, no. 18, pp. 2677–2681, 2014.
[6] O. Loubani and D. W. Hoskin, “Paclitaxel Inhibits Natural Killer Cell Binding to Target Cells by Down-Regulating Adhesion Molecule Expression,” vol. 742, pp. 735–741, 2005.
[7] Y. Ling, Y. Zhong, and R. Perez-Soler, “Disruption of cell adhesion and caspase-mediated proteolysis of beta- and gammacatenins and APC protein in paclitaxel-induced apoptosis.,” Mol. Pharmacol., vol. 59, no. 3, pp. 593–603, 2001.