Dr. Inge Thijssen-van Loosdregt 1
Manish Kumar 2
1 CytoSMART Technologies B.V., Eindhoven, The Netherlands; 2 PromoCell GmbH, Heidelberg, Germany
Introduction
Chronic wounds are a major health care problem, costing more than $28 billion annually to the U.S. healthcare system alone. 1 In order to develop effective treatment plans of chronic wounds, it is important to understand the cutaneous wound healing process. One of the most important steps in this process, is re- epithelialization of the of the wounded skin. 2 It is essential that the wound is covered by keratinocytes as quickly as possible in order to regain structural and functional integrity of the skin. This re-epithelialization is orchestrated by many factors, such as growth factors and cytokines. Keratinocyte Growth Factor (KGF) for example, induces keratinocytes along the wound edge to migrate into the wound site to close it. 3,4 In order to initiate migration, the keratinocytes first need to polarize and thereafter activate myosin II motors that contract actin filaments inside the cells.
To get more insight into the re-epithelialization process, in vitro studies are necessary. One of the most commonly used methods to investigate keratinocyte migration is the wound healing assay (also called scratch assay). In this assay, a wound is made in a confluent monolayer of cells and the wound closure over time is analyzed by using microscopy images. Generally, the microscopy images are taken at only a few timepoints since the cells need to be taken out of the incubator to take the images. Because of this, kinetic information about the wound healing process is very limited. Furthermore, it is difficult to find the same field of view at each timepoint, making it a labor- intensive process. In-incubator, automated, live-cell imaging could be the answer to these issues since the cells do not need to be taken out of the incubator when using this technique. This enables the acquisition of wound healing data with a high temporal resolution. The CytoSMART® Omni, for example, can image and analyze wound closure at regular time intervals inside the incubator.
In this study, the effect of the growth factor KGF and the myosin II-inhibitor Blebbistatin on keratinocyte migration was investigated using live-cell imaging. Cells were kept at 37° C and 5% CO2 for the duration of the experiment and imaged with a high temporal resolution using the CytoSMART® Omni. By using this method, we aimed to obtain a better understanding of the kinetic process of keratinocyte migration.
Material and Methods
Normal Human Epidermal Keratinocytes (NHEK; C-12001, PromoCell) were cultured in Keratinocyte Growth Medium 2 (KGM2; C-20011, PromoCell) up to passage 4. After detachment using the DetachKit (C-41200; PromoCell), NHEKs were seeded (passage 5) using KGM2 in a 48-well plate at a density of 21,000 cells/cm2 . After three days of culture (37°C and 5% CO2 ), 100% confluence was reached and a wound was made in the NHEK monolayer using a 200 µl pipette tip. The samples were rinsed with PBS, and subsequently provided with KGM2 supplemented with 0.1, 1, 10 or 100 nM Keratinocyte Growth Factor (KGF; C-63821, PromoCell) or 0, 2.5, 5 or 10 µM Blebbistatin (Bleb; B-0560, Sigma-Aldrich).
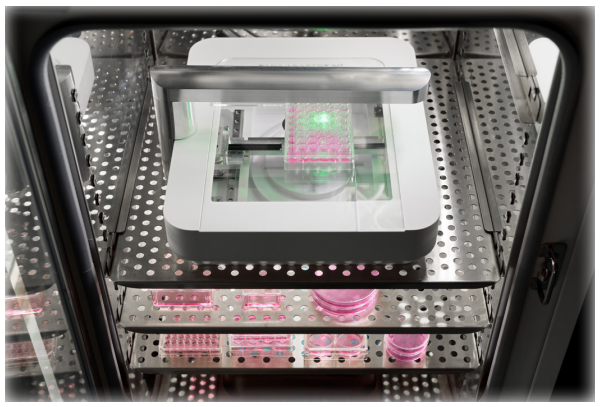
Figure 1. The 48-well plate placed on the CytoSMART® Omni that is placed inside a cell culture incubator.
Thereafter, the well plate was placed on the CytoSMART® Omni (37°C and 5% CO2 ; Fig. 1) for 48 hours to make a high-resolution image of the entire well plate every hour. The images were automatically uploaded to the CytoSMART® Cloud, where the wound area and migration speed were calculated using the CytoSMART® scratch analysis algorithm (Fig. 2). The data was downloaded from the CytoSMART® Cloud to calculate the average migration speed and the percentage of wound closure compared to the first timepoint. Prism (GraphPad) was used to analyze differences in percentage wound closure using two-way ANOVA followed by a Tukey’s multiple comparisons test. Differences in the average migration speed were determined using one-way ANOVA followed by a Tukey’s multiple comparisons test. For both analyses, differences were considered significant at p < 0.05. All data is reported as mean ± standard error of mean.
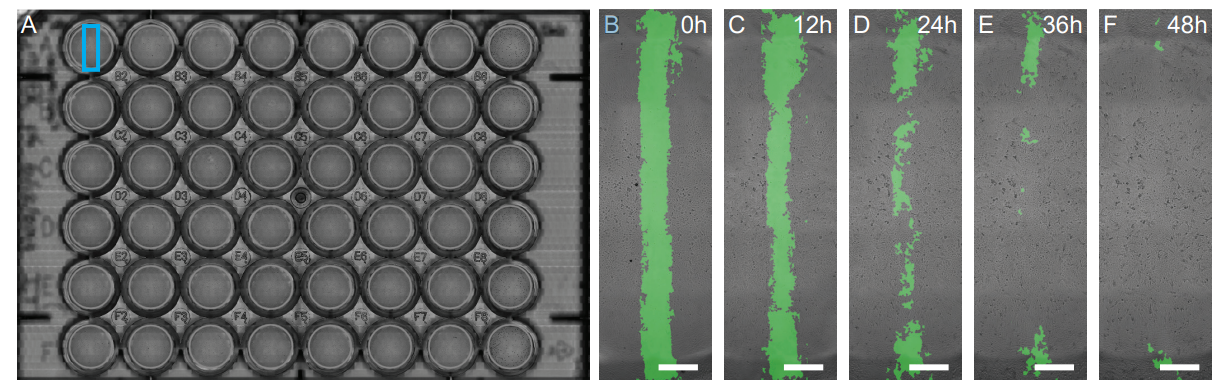
Figure 2. (A) A high-resolution scan of the 48-well plate. The analysis of the wound area of well A1 (100 nM KGF), indicated by the blue box, is shown in detail in (B-F). The detected wound area at 0 (B), 12 (C), 24 (D), 36 (E) and 48 h (F) is indicated by the green overlay. Scale bars in B-F represents 1 mm.
Results
Wound closure was similar in all groups during the first part of the experiment (Fig. 3A). From 16 h onward, differences in wound closure started to appear between the Blebbistatin and KGF treated NHEKs (Fig. 3). After 37h, all Blebbistatin treated groups had a significantly lower percentage of wound closure compared to the KGF treated groups. The higher the Blebbistatin concentration, the faster significant differences with the KGF treated groups occurred (Fig. 3B-E). Starting from 41 h, wound closure of 100, 10 and 0.1 nM KGF treated NHEKs was significantly higher than that of the control samples. After 48 h, all Blebbistatin treated samples had a significantly lower wound closure (10 µM Bleb: 67 ± 3%, 5 µM Bleb: 73 ± 7%, 2.5 µM Bleb: 74 ± 9%) than the KGF treated samples (p ≤ 0.001; 100 nM KGF: 94 ± 1%, 10 nM KGF: 93 ± 2%, 1 nM KGF: 92 ± 2%, 0.1 nM KGF: 94 ± 2%). Additionally, the wound closure of the control NHEKs (78 ± 8%) was significantly lower compared to the 100, 10 and 0.1 nM KGF treated NHEKs (p < 0.02).
The average migration speed of the 10 µM Blebbistatin treated group (15 ± 1 µm2 /s) was significantly lower compared to all groups, except control (Fig. 4). The average migration speed of the control group (22 ± 2 µm2 /s) was significantly lower than the 100 (31 ± 1 µm2 /s), 1 (30 ± 1 µm2 /s) and 0.1 nM (33 ± 1 µm2 /s) KGF treated groups. The 5 µM Blebbistatin group (24 ± 2 µm2 /s) had a significantly lower migration speed compared to the 0.1 nM KFG2 group. The 2.5 µM Blebbistatin treated NHEKs (23 ± 3 µm2 /s) migrated significantly slower than the 100, 10 (27 ± 1 µm2 /s) and 0.1 nM KGF treated NHEKs.
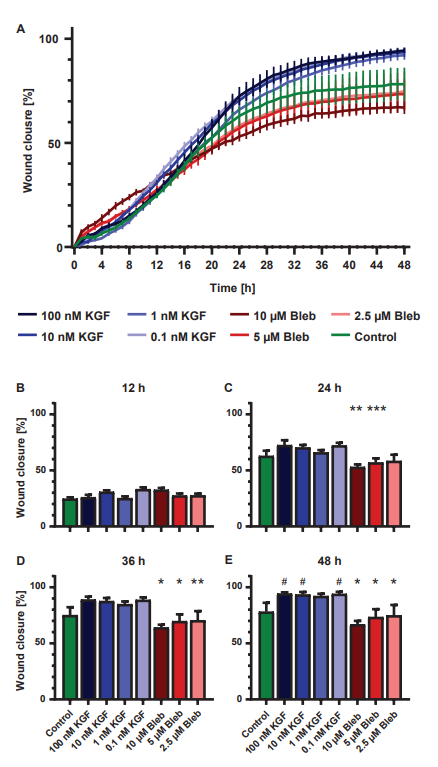
Figure 3. (A) Increase in percentage wound closure over time (mean ± standard error of mean; n=6). (B-E) Difference in percentage wound closure at 12 (B), 24 (C), 36 (D) and 48 h (E) (mean ± standard error of mean; n=6). *: Significantly lower than all KGF concentrations, **: significantly lower than 0.1, 10 and 100 nM KGF, ***: significantly lower than 0.1 and 100 nM KGF and #: significantly higher than control (p<0.05).
Discussion
The first step towards chronic wound care is understanding the wound healing process, which is initiated by re-epithelialization. Wound re-epithelialization is commonly studied in vitro via wound healing assays using keratinocytes. However, these assays usually provide very limited kinetic information about the keratinocyte migration process since creating kinetic data requires taking the sample out of the incubator multiple times to analyze, which is time-consuming and non-beneficial for cell health. In this study, we aimed to overcome this problem by using the CytoSMART® Omni, an automated live-cell imager that is placed inside the incubator to automatically image and analyze wound closure every hour to obtain high temporal resolution data.
Here, it was shown that the wound closure and average migration speed of NHEKs were impared by treatment with Blebbistatin. High-resolution kinetic live-cell imaging has revealed that wound closure was inhibited in a dose-dependent manner; the higher the blebbistatin concentration, the earlier it had an effect on the wound closure. Blebbistatin inhibits cell migration by inhibiting myosin II ATPase, which in turn decreases the ability of myosin II to contract actin filaments. In physiological conditions, myosin II is involved in propelling the cell forward by generating contractile forces at the leading edge of the cell.5,6 Simultaneously, myosin II facilitates contraction of actin filaments at the trailing end which causes detachment of the trailing end.6
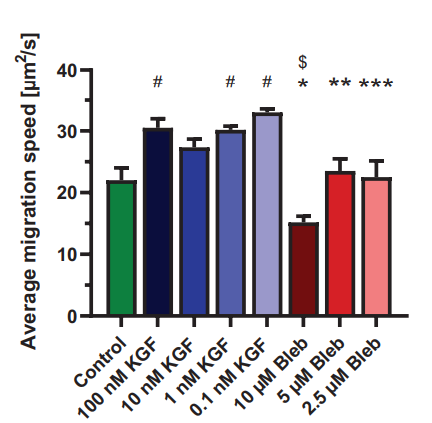
Figure 4. The average migration speed (mean ± standard error of mean; n=6). *: Significantly lower than all KGF concentrations, **: significantly lower than 0.1, nM KGF, ***: significantly lower than 0.1, 1 and 100 nM KGF, $:significantly lower than 2.5 and 5 µM Bleb and #: significantly higher than control (p<0.05).
Furthermore, it was demonstrated that wound closure and average migration speed were upregulated upon addition of KGF to the keratinocytes. Starting from approximately 20 h, the high temporal resolution scans revealed a trend in increased wound closure compared to control samples. However, this increase did not seem to be dose-dependent. Previous research has shown that the growth factor KGF upregulates cell migration via induction of actin-rich lamellipodia at the leading edge of the cell which in turn increased the migratory capabilities of the keratinocytes.3,7
Conclusion
By using the automated live-cell imaging and analysis capabilities of the CytoSMART® Omni, high-resolution kinetic information about NHEK migration was obtained. This information provided insight in the time-dependent effect of blebbistatin and KGF on the migration process of keratinocytes. Next to obtaining detailed kinetic information about keratinocyte migration, the automated imaging and analysis of the CytoSMART® Omni made the experimental process a lot less labour-intensive since there was no need to remove the samples from the incubator for imaging.
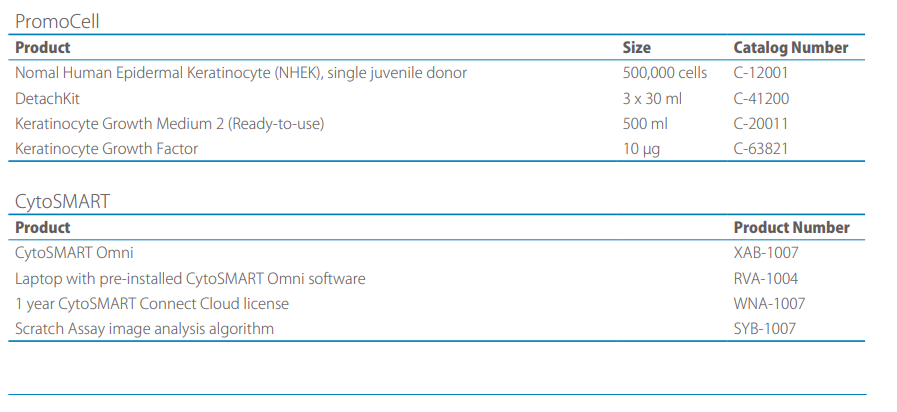
Products
References
[1] Nussbaum, S. R. et al. An Economic Evaluation of the Impact, Cost, and Medicare Policy Implications of Chronic Nonhealing Wounds. Value in Health, 21, 27–32 (2018).
[2] Shaw, T. J. & Martin, P. Wound repair: a showcase for cell plasticity and migration. Current Opinion in Cell Biology, 42, 29–37 (2016).
[3] Seeger, M. A. & Paller, A. S. The Roles of Growth Factors in Keratinocyte Migration. Advances in Wound Care, 4, 213–224 (2015).
[4] Tsuboi, R. et al. Keratinocyte Growth Factor (FGF-7) Stimulates Migration and Plasminogen Activator Activity of Normal Human Keratinocytes. Journal of Investigative Dermatology 101, 49–53 (1993).
[5] Tang, D. D. & Gerlach, B. D. The roles and regulation of the actin cytoskeleton, intermediate filaments and microtubules in smooth muscle cell migration. Respir Res, 18, 54 (2017).
[6] Matsumura, F. et al. Specific Localization of Serine 19 Phosphorylated Myosin II during Cell Locomotion and Mitosis of Cultured Cells. Journal of Cell Biology, 140, 119–129 (1998).
[7] Ceccarelli, S. et al. Cortactin involvement in the keratinocyte growth factor and fibroblast growth factor 10 promotion of migration and cortical actin assembly in human keratinocytes. Experimental Cell Research, 313, 1758–1777 (2007).