E-books
E-book: The Clonogenic Assay
Author:
Jenna Bleloch, Ph.D.
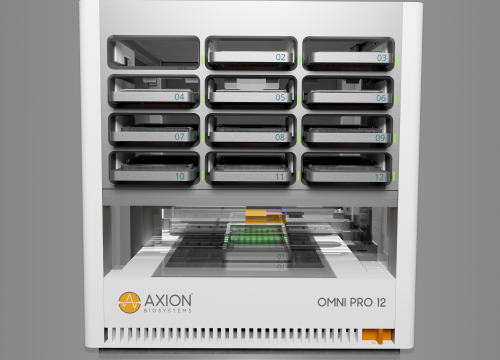
Product:
Omni,
Clonogenic Assay Module,