C. Roma-Rodrigues, L.R. Raposo, P.V. Baptista and A.R. Fernandes from UCIBIO, DCV, FCT-NOVA, Portugal; written by T.M. van Haaften, MSc from CytoSMART Technologies, Netherlands
Research use only. Not intended for diagnostic purposes.
Case study: Researchers from UCIBIO Universidade Nova de Lisboa have used fluorescence live-cell imaging to assess anticancer drug response in a 3D cell model.https://www.cytosmart.com/applications/oncology/cancer-spheroid
Introduction
Spheroid cell culture emerges as a powerful in vitro tool for research into oncology treatment. Although most research regarding cancer biology is based on experiments using in vitro 2-dimensional (2D) cell cultures, this model often lacks the complexity to mimic in vivo structures of the tissue or tumour. By mimicking the 3-dimensional (3D) network of cell-cell interactions and oxygen- and nutrient gradients, tumour spheroids resemble many aspects of the pathophysiologic environment within human tumour tissue [4,5].
Tumour cells are less sensitive to drugs in 3D than in 2D cultures. This effect may be caused by reduced direct access to compounds in the medium or by pathophysiological characteristics of the 3D cellular construct due to hypoxia or differences in cell cycle [5]. The extent to which biological processes are affected, as well as the timing and depth of internalisation are aspects that are essential to take into account in the development of efficient nontoxic anti-tumour drugs.
By using continuous live-cell imaging, the CytoSMART Lux3 FL enables to monitor drug internalisation into the tumour spheroid, as well as following biological processes and morphologic changes of the tumour spheroid. This case study provides a proof of concept for the evaluation of anticancer drug response using live-cell imaging.
“The Lux3 FL allows us to continually monitor our 3D tumour spheroid formation and assess response to drugs in 2D or 3D cell models in an easy and user-friendly manner!”
Method
After an 8-day maturation period, the spheroid consisting of the colorectal carcinoma HCT116 cell line was incubated with CellTrace™ CFSE (peak excitation 492 nm; peak emission 517 nm) in phenol-red depleted medium [1], to stain viable cells with green fluorescence. After washing three times with fresh medium, the spheroid was exposed to 10 µM Doxorubicin, a red fluorescent anti-tumour drug. Doxorubicin has emission signal at 590-595 nm upon excitation at 450-480 nm and binds to DNA [3].
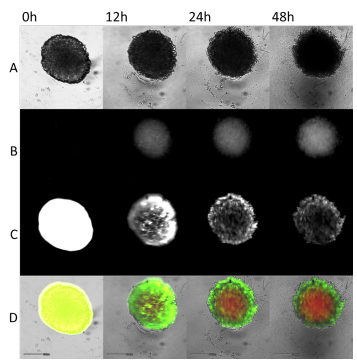
The absorption of Doxorubicin by the cells in the spheroid and its effect on spheroid integrity and viability was monitored using timelapse imaging (Fig. 1). Brightfield and fluorescen images were captured every 15 minutes for 2 days using the CytoSMART Lux3 FL that was placed inside a 37°C 5% CO₂ incubator [6]. The mean intensity of total fluorescent signal was determined with ImageJ.
Results
The initial time point of drug internalisation can be determined with continuous live cell imaging (Fig. 2). The trend of red fluorescence signal indicates that Doxorubicin infused rapidly into the tumour spheroid from t=3h 45min after drug treatment and slowed down after t=6h. At t=1h 45min and t=21h the focus is adjusted resulting in a shift in fluorescence signal.
The viability of the tumour cells is monitored by green fluorescence signal. Although the signal naturally fades due to proliferation, the overall exponential reduction in fluorescence signal was an indication of loss of viable cells (Fig. 3). Figure 1 shows the internalisation of Doxorubicin into the tumour spheroids at t=0h, 12h, 24h and 48h. The distribution of the green fluorescence indicates that the bulk of viable cells was predominantly located in the outermost layer of the spheroid.
The morphologic transformation of the tumour spheroid over time is evidently visible in the brightfield images (Fig. 1A). After addition of Doxorubicin the spheroid was round and compact, while the spheroid lost its cohesive appearance and develops an inconsistent spheroid periphery after prolonged exposure to Doxorubicin. The spheroid size increased as cells tend to detach. As a consequence, cell debris formed at the bottom of the well after 1 day.
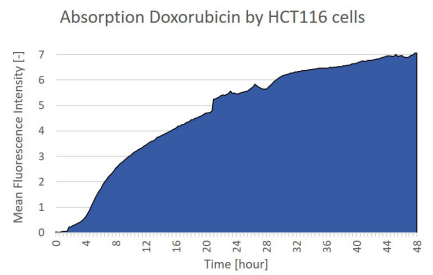
Figure 2. Mean intensity of total red fluorescence signal, indicating the absorption of Doxorubicin by HCT116 cells within the spheroid.
Discussion
Correlating drug internalisation and time-dependent effects on cell viability and morphology provides refined insight into cellular responses to Doxorubicin treatment. We showed that kinetic data provides a strong basis to follow drug internalisation into 3D cultures. Next to high temporal resolution, the combination of fluorescence and brightfield imaging enables the interpretation of biological processes to a deeper extent. This detailed evaluation provides a reliable roadmap of time-dependent cellular responses caused by Doxorubicin treatment.
Doxorubicin is one of the most commonly used chemotherapeutic drugs and due to its inherent fluorescence, a popular research tool as well. However, a shift in pH and/or temperature influences the cellular uptake of Doxorubicin drastically [2]. Continuous monitoring with the CytoSMART Lux3 FL allows to interpret drug internalisation into the tumour spheroid in absence of environmental changes that may affect cellular responses.
In this study, we have demonstrated that the CytoSMART Lux3 FL can be used to efficiently image and analyse drug internalisation of tumour spheroids at optimal culture conditions.
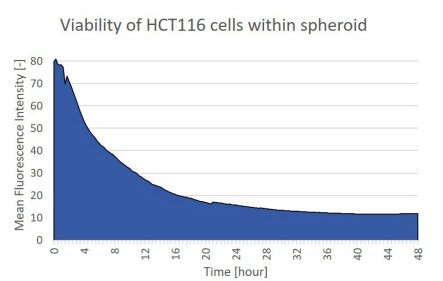
Figure 3. Mean intensity of total green fluorescence signal, indicating the loss of viability of HCT116 cells within the spheroid.
Acknowledgements
We thank Catarina Roma-Rodrigues and Luís R. Raposo (Faculdade de Ciêndias e Tecnologica, Universidade Nova de Lisboa, Portugal) for performing the experiments and providing the videos and images. We thank Prof. Pedro V. Baptista (FCT-UNL, Portugal) for assistance and useful discussions on 3D imaging. Special thanks to Prof. Alexandra R. Fernandes (FCT-UNL, Portugal) for supporting this project.
References
1. BAEK, NamHuk, et al. Monitoring the effects of doxorubicin on 3D-spheroid tumor cells in real-time. OncoTargets and therapy, 2016, 9: 7207.
2. FARAZI, R., et al. Effect of pH and temperature on doxorubicin hydrochloride release from magnetite/graphene oxide nanocomposites. Materials Today: Proceedings, 2018, 5.7: 15726-15732.
3. KAUFFMAN, Melinda K., et al. Fluorescence-based assays for measuring doxorubicin in biological systems. Reactive oxygen species (Apex, NC), 2016, 2.6: 432.
4. MA, Hui-li, et al. Multicellular tumor spheroids as an in vivo–like tumor model for three-dimensional imaging of chemotherapeutic and nano material cellular penetration. Molecular imaging, 2012, 11.6: 7290.2012. 00012.
5. NUNES, Ana S., et al. 3D tumor spheroids as in vitro models to mimic in vivo human solid tumors resistance to therapeutic drugs. Biotechnology and bioengineering, 2019, 116.1: 206-226.
6. ROMA-RODRIGUES, C. et al. Hyperthermia Induced by Gold Nanoparticles and Visible Light Photothermy Combined with Chemotherapy to Tackle Doxorubicin Sensitive and Resistant Colorectal Tumor 3D Spheroids. Int. J. Mol. Sci. 2020, 21, 8017.